
From dashboard noise to a KPI narrative
A four-beat structure for turning application analytics into a story leadership can act on.
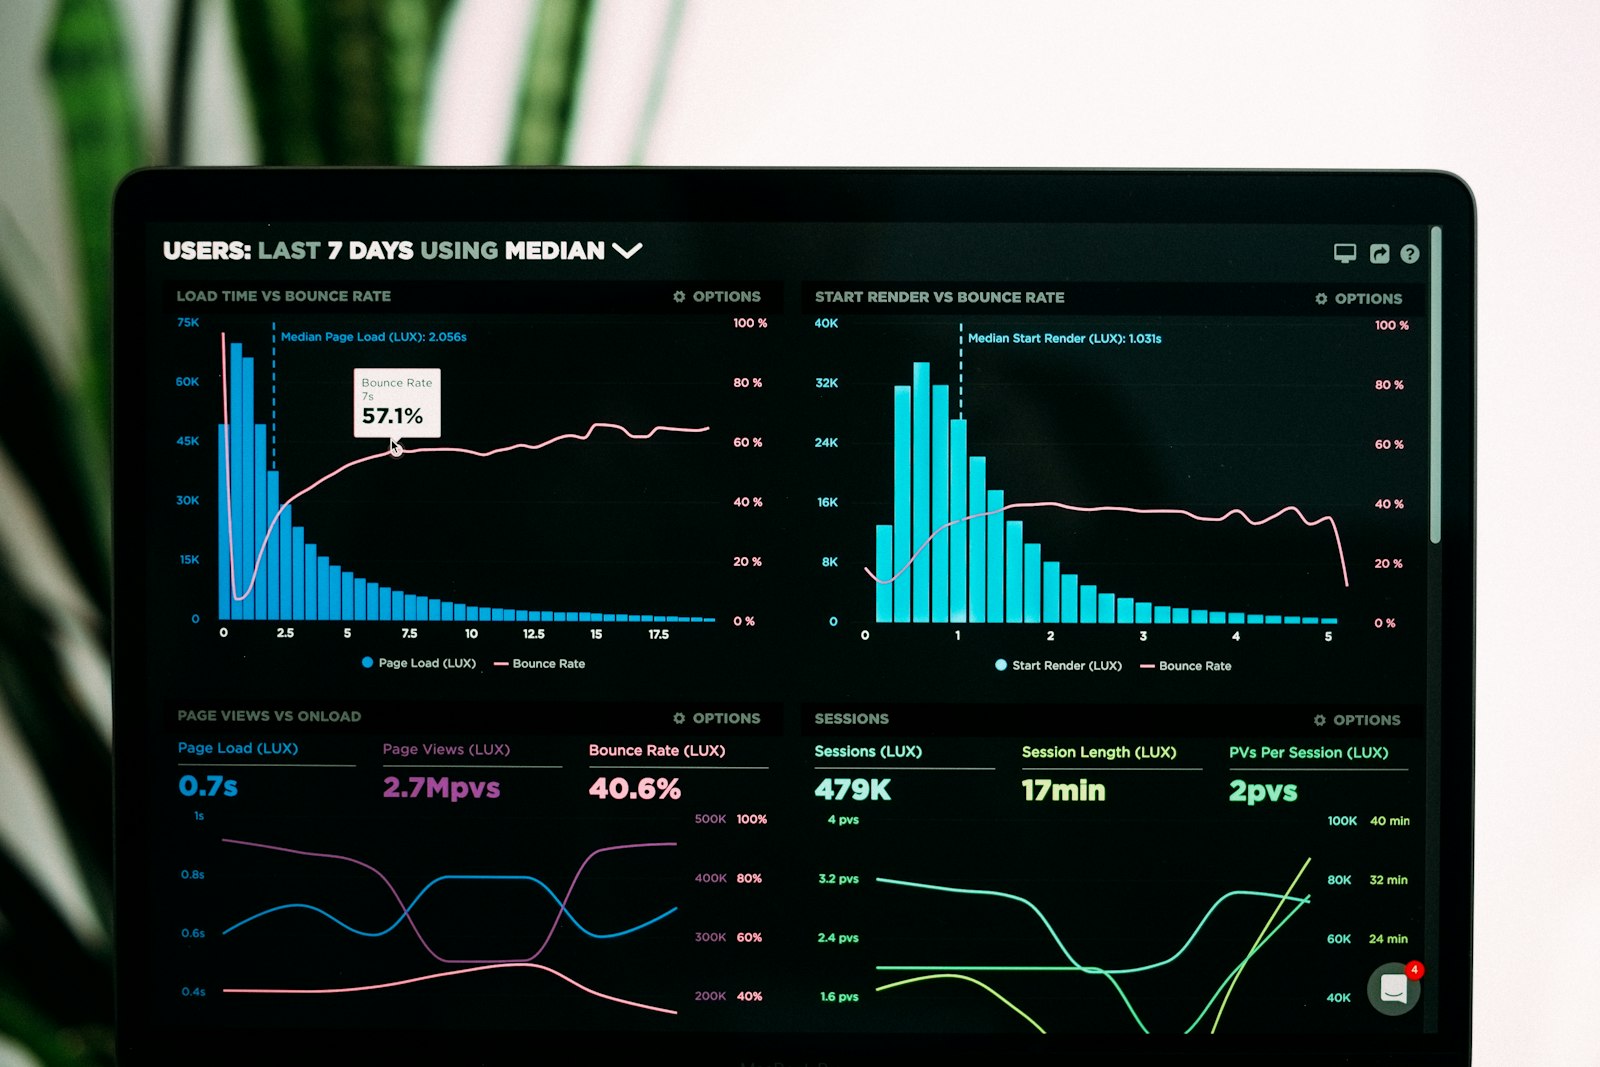
Cache Fieldgrid
We coach teams to frame KPIs so stakeholders grasp the plot: what moved, why it matters, and which decision comes next.
Flagship preview
A hands-on path through event hygiene, leading indicators, and stakeholder-ready storytelling — built for people who already live inside dashboards.
You leave with a reusable narrative template, a critique checklist, and a scored review of one live product story from your own application analytics stack.

What you practice
Separate vanity spikes from durable product movement before anyone builds a slide around the wrong number.
Map application events to a beginning, tension, and decision — so KPI storytelling feels intentional, not decorative.
Rewrite the same insight for engineering, marketing, and leadership without diluting the evidence.
From the studio floor
“The module on leading indicators stopped us from celebrating a retention chart that was mostly a cohort artifact. We still argue about slides — but now we argue about the right ones.”
Client in fintech: “KPI Narrative Studio gave our PM and data pair a shared vocabulary. One limitation: if your event taxonomy is a mess, week one feels slow — and that is probably the point.”
Tell us which product KPI story is stuck. We will point you to the right course path or a conversation with the Bangkok team.